
On Slimlink, you can generate a custom report for your links by applying filters in the Analytics section. Filters allow you to narrow down the data based on specific criteria, such as timeframes, referral sources, geographic locations, or tags. Once you’ve set the desired filters, the system will display the refined analytics that match your preferences. You can then export this filtered data as a report (provided this option is covered by your subscription plan), making it easy to share or analyze further. This approach helps you focus on the metrics that matter most to your goals.
To quickly return to the unfiltered data for broader analysis, click Clear filters. This option resets all applied filters, removing any customizations and reverting the analytics view to its default state.
To view customized analytics data:
- Log in to your Slimlink account.
- Navigate to the Analytics section.
- Use the filter section as described below to customize your data display.
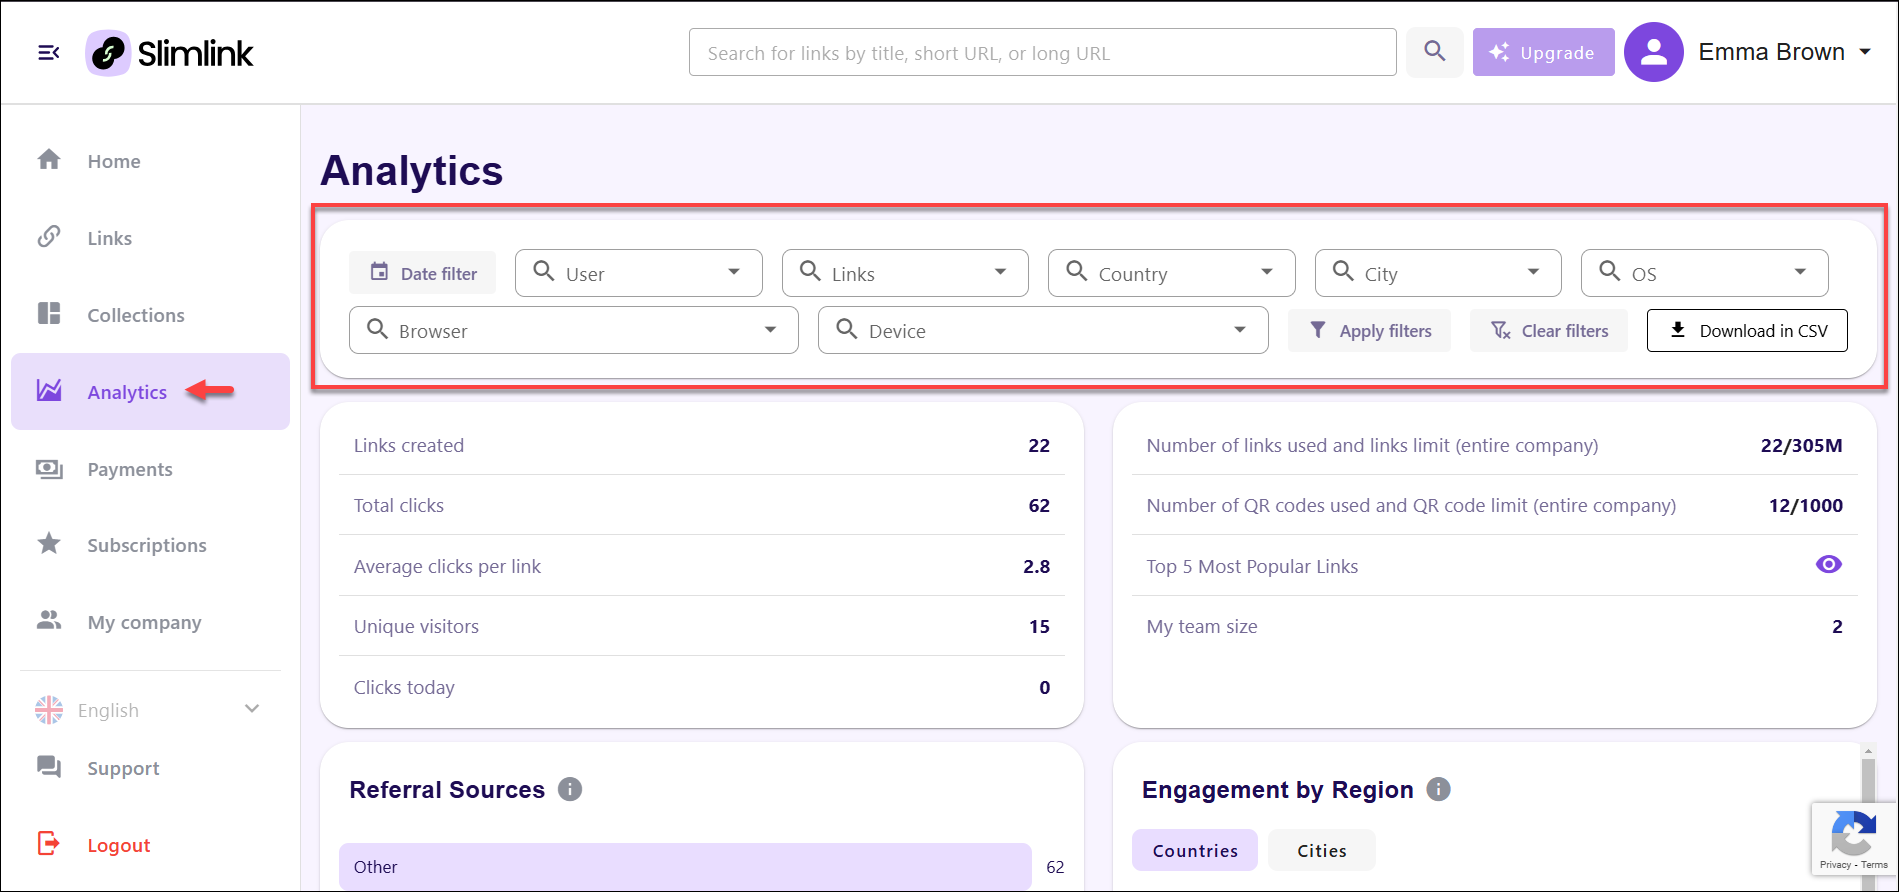
Each filtering option allows to focus on specific aspects of the data, ensuring a targeted and meaningful analysis:
- Date filter: This option lets you specify a custom date range to analyze data within a selected period. By choosing a start and end date, you can evaluate trends, performance, or engagement for particular timeframes, such as a specific week, month, or campaign duration.
- User: This filter enables the selection of individual users whose activities are to be analyzed. It is particularly useful for identifying the performance of team members, individual accounts, or contributors, highlighting their impact on link clicks, link creation, and other metrics.
- Links: This option allows to focus the analytics on specific links, selected by title from the dropdown list. By narrowing the analysis to particular links, users can assess the effectiveness and engagement metrics of specific campaigns, promotions, or resources.
- Country: This filter provides the ability to segment data based on the geographical location of users at the country level. It is valuable for understanding regional engagement trends, identifying high-performing markets, or tailoring marketing strategies to specific regions.
- City: Refining the country filter further, this option enables you to analyze data at the city level. It is helpful for identifying localized trends, monitoring engagement in specific urban areas, or comparing city-specific performance within a country.
- OS (Operating System): This filter categorizes analytics data based on the operating systems used by users, such as Windows, macOS, iOS, or Android. It provides insights into the devices users rely on, helping to optimize campaigns and platforms for the most commonly used systems.
- Browser: This filter enables the selection of specific web browsers preferred by users, such as Chrome, Firefox, Safari, or Edge. It allows businesses to assess compatibility and engagement across different browsing environments, ensuring optimal user experience.
- Device: This filter focuses on the analysis of the user device models, giving you insights into engagement from specific devices, such as iPhone, or Samsung. This detailed information helps you understand which devices are most commonly used by your audience.
- Once the filters are selected, click Apply filters to apply the chosen criteria to the data set, updating the analytics view to display refined and targeted insights based on the selected parameters.
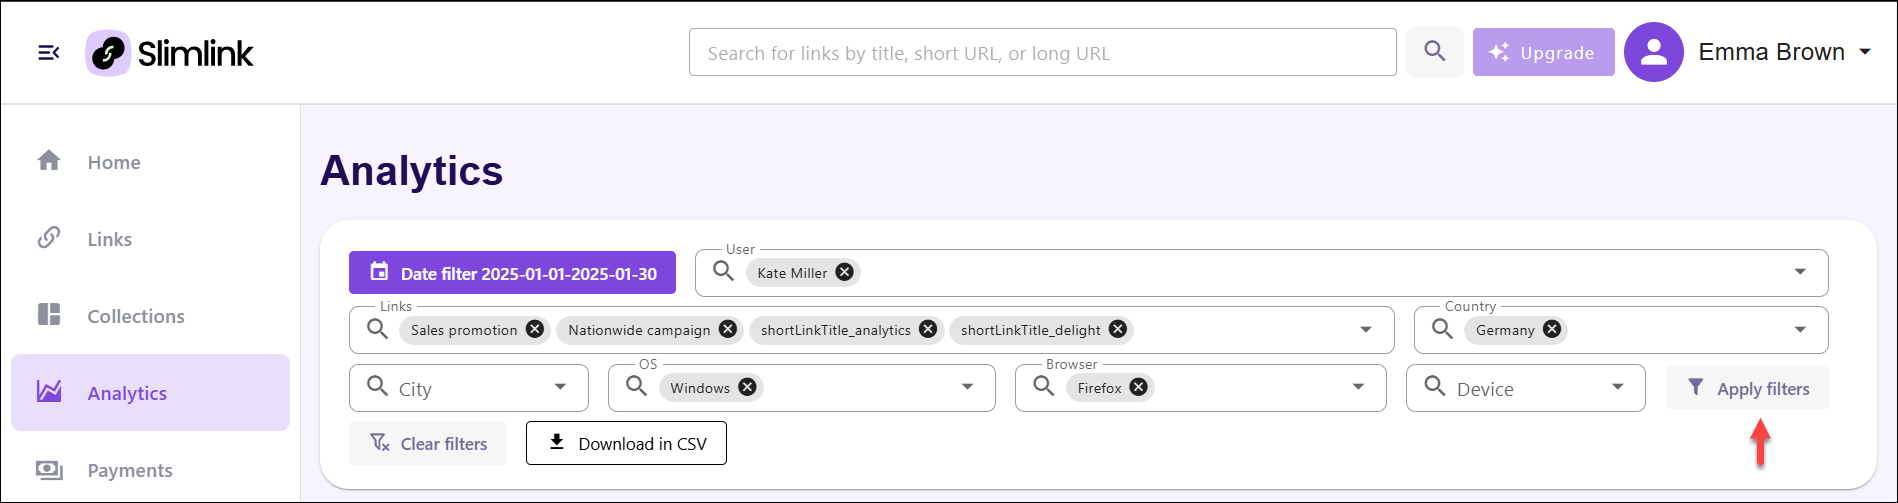
To quickly return to the unfiltered data for broader analysis, click Clear filters. This option resets all applied filters, removing any customizations and reverting the analytics view to its default state.