For more granular insights, you can also review individual link analytics within the collection. This combination of broad and detailed data allows you to identify trends, optimize strategies, and measure the success of your grouped links effectively.
To track collection performance:
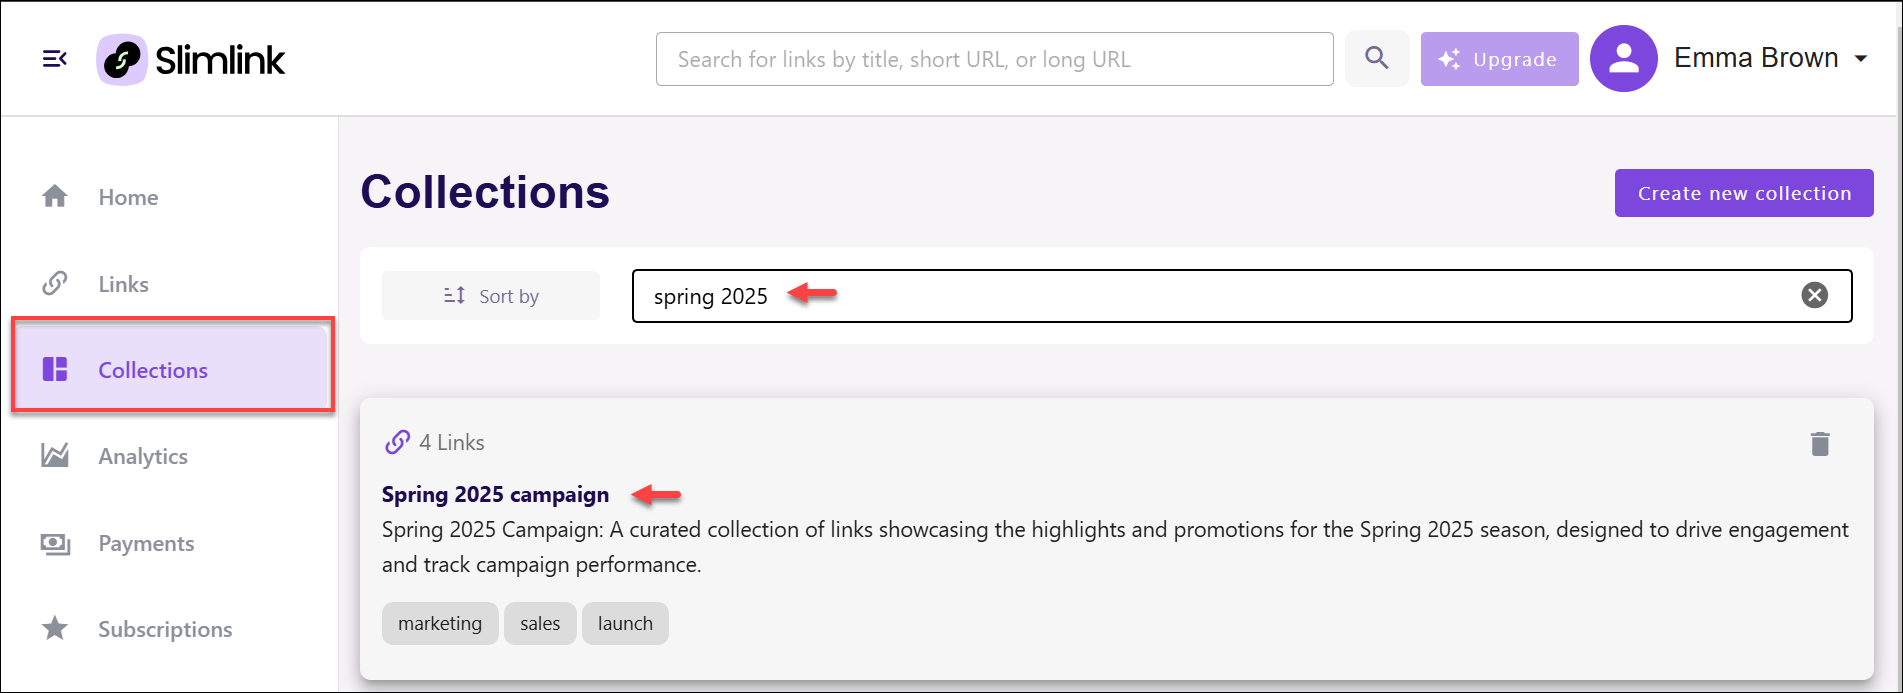
- Log in to your Slimlink account.
- Navigate to the Collections section and find the required collection.
- Click the entry to open the detailed view.
- Scroll down the collection page to the Top 5 countries and Statistics sections.
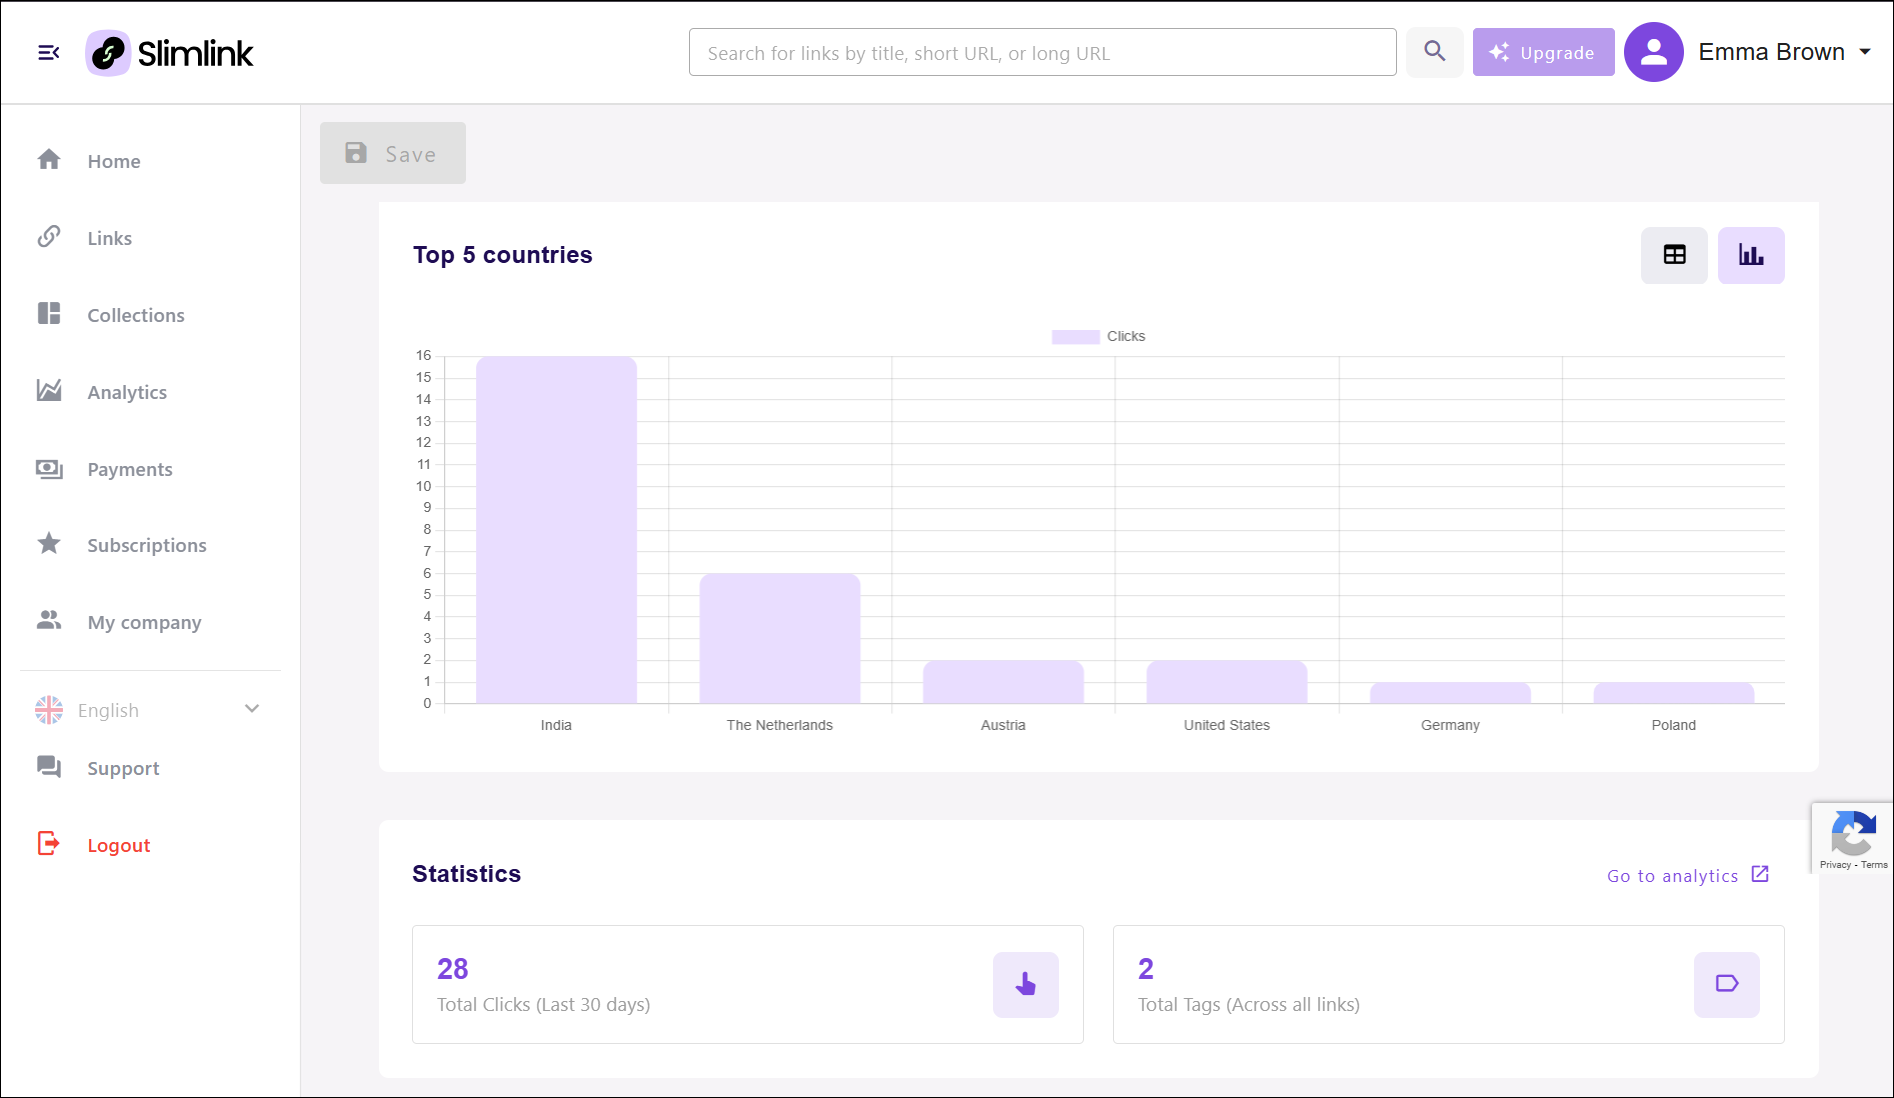 Top 5 Countries: Displays a bar chart showing the top five countries generating the most clicks. Each bar represents the number of clicks per country, providing a visual comparison of engagement. This section highlights which regions are driving the most traffic. Includes the View toggle, which helps to switch between table view and chart view. The table icon displays click data in a tabular format, while the chart icon shows data graphically.
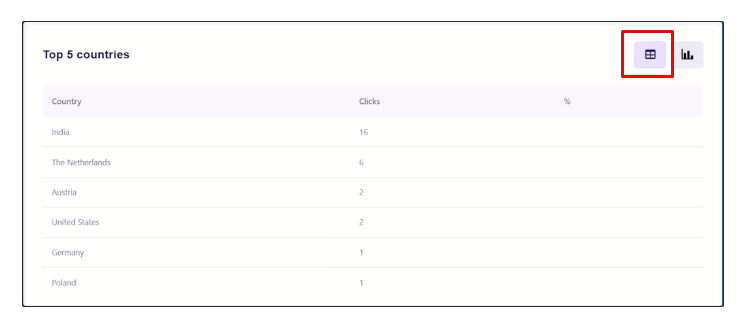 Statistics: Summarizes overall engagement metrics, displaying total clicks over the last 30 days and the total number of tags across all links. This section provides quick insights into recent activity and link categorization.
- Total Clicks (Last 30 days): Indicates the cumulative number of clicks recorded over the past 30 days. This metric reflects the engagement level of shortened links within the specified period.
- Total Tags (Across all links): Shows the number of unique tags applied across all links. Tags are used to categorize and organize links, enhancing manageability and filtering options.
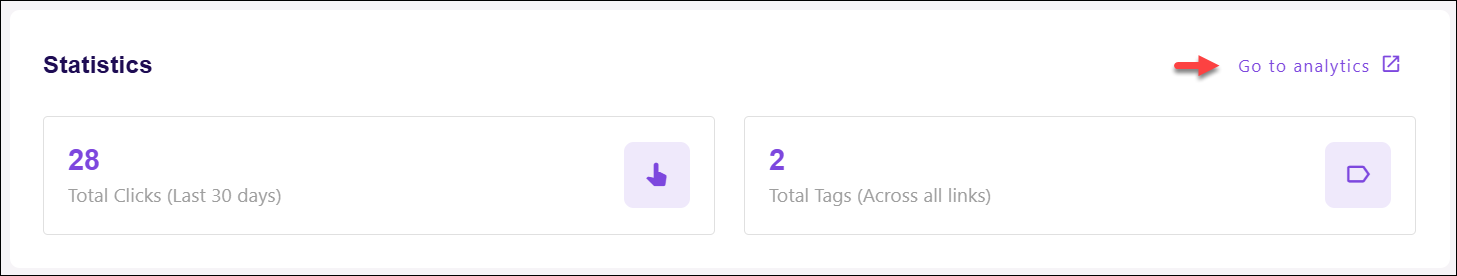
- Click Go to Analytics to view the full analytics section for deeper insights and more detailed reports. This link provides expanded collection data beyond the summary shown on this page, as described below.
Filter: Allows you to filter collection analytics data based on selected parameters.
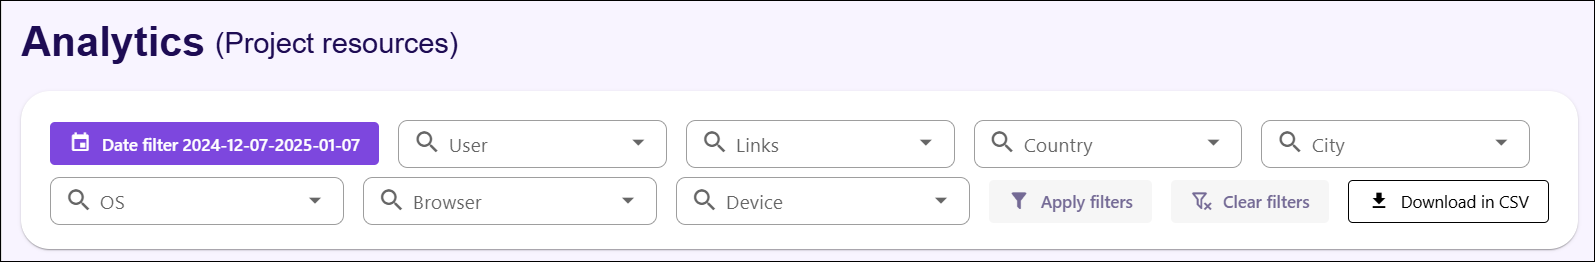
- Date: Allows to select a date range to filter the data shown on the page. This narrows down analytics to a specific timeframe.
- User: Enables filtering of analytics data based on company users interacting with the links. This filter is available only to the company owner and users with managerial position (who have other users in their team).
- Links: Filters results by specific links, allowing users to view performance metrics for selected URLs.
- Country: Enables filtering by country, highlighting link activity based on geographical locations.
- City: Narrows analytics down by city, providing more localized insights into link engagement.
- OS: Filters data based on the operating system used by visitors interacting with the links.
- Browser: Allows to filter link analytics by the browser used to access the links.
- Device: Filters data by device model, giving you insights into engagement from specific devices, such as iPhone, Samsung, etc. This detailed information helps you understand which devices are most commonly used by your audience.
Action buttons:
- Apply Filters: Applies the selected filters and refreshes the analytics data displayed on the page.
- Clear Filters: Clears all applied filters, returning the page to its default unfiltered state.
- Download in CSV: Downloads the filtered analytics data in CSV format for external analysis or reporting.
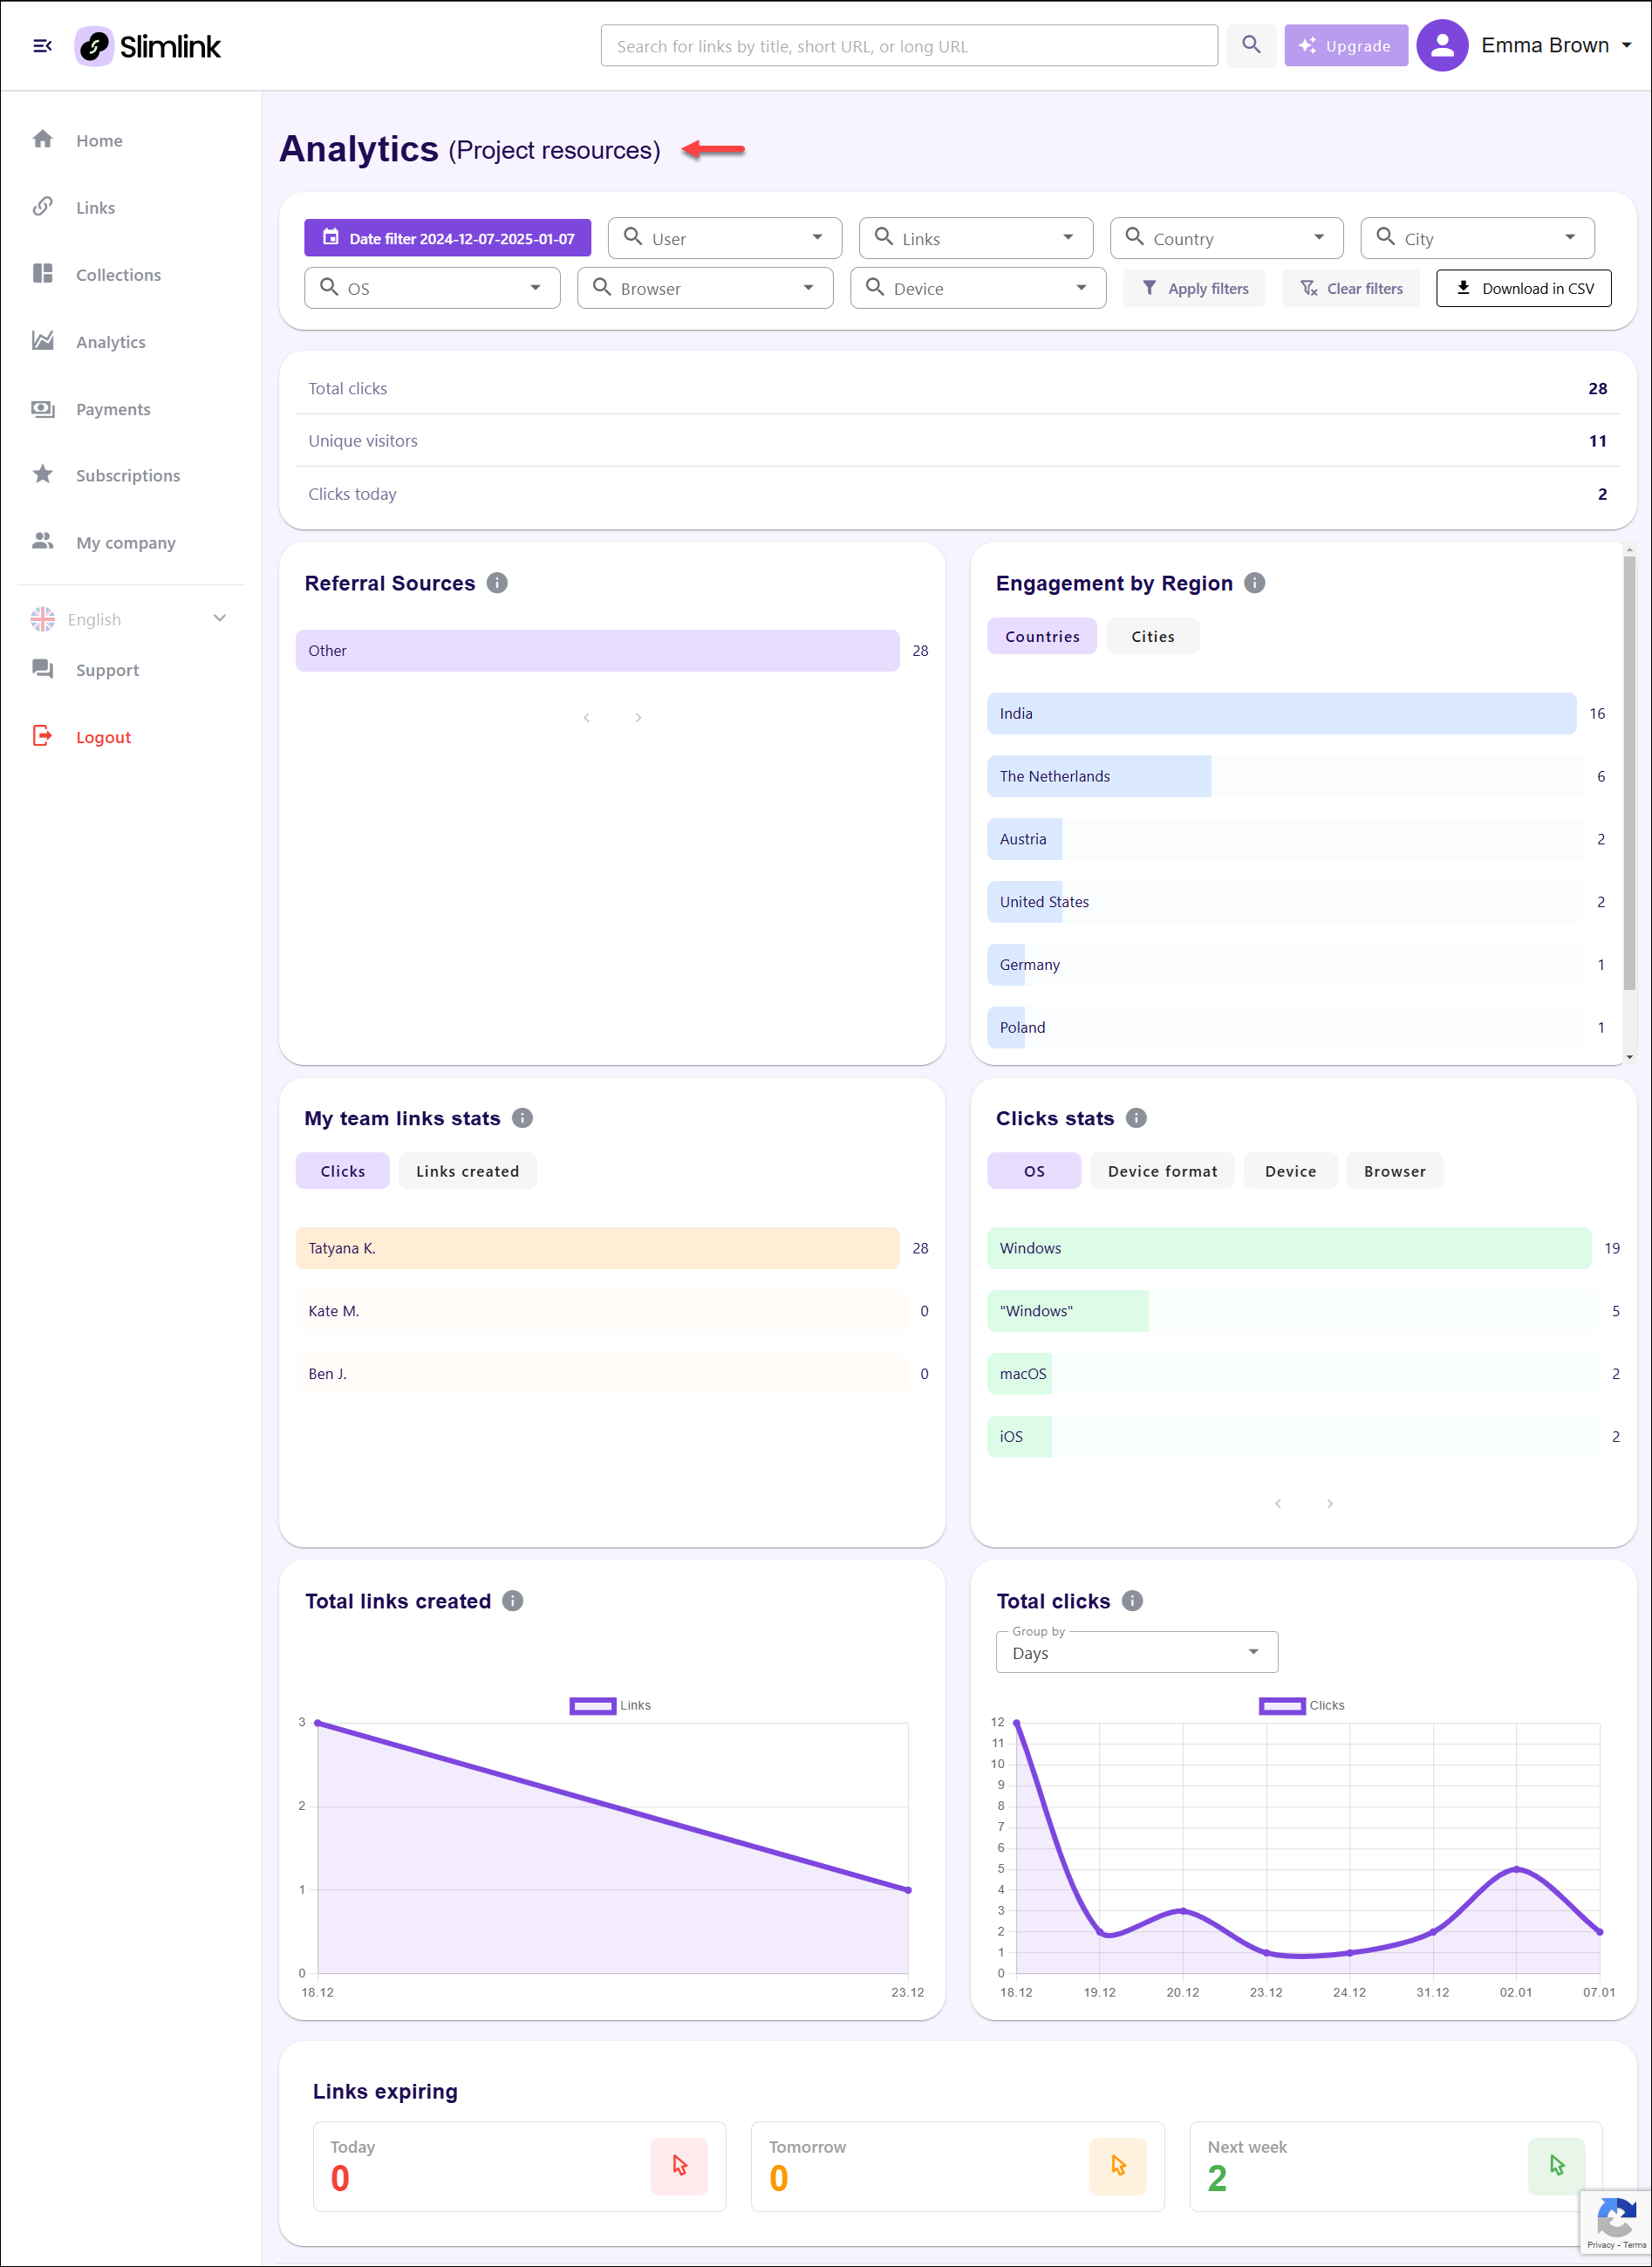
Analytics: Displays analytics data for a collection within the link shortening service. It provides insights into user activity, link performance, and regional engagement.
Key Engagement Metrics: Displays three core performance indicators summarizing user interaction and engagement with links over a selected period.
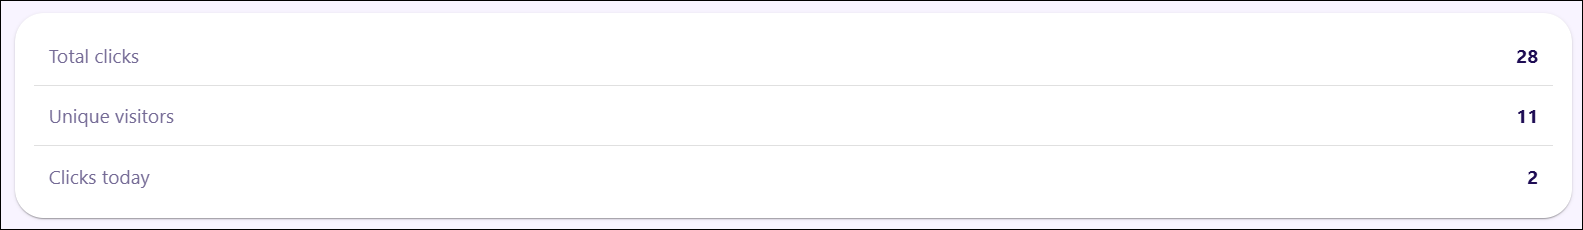
- Total Clicks: Represents the cumulative number of times all links have been clicked. This metric reflects overall engagement and measures the reach of the links.
- Unique Visitors: Shows the number of distinct users who have interacted with the links. Unlike total clicks, this highlights how many individual users have engaged, indicating audience size.
- Clicks Today: Tracks the number of link clicks recorded on the current day. This metric provides insight into daily engagement trends.
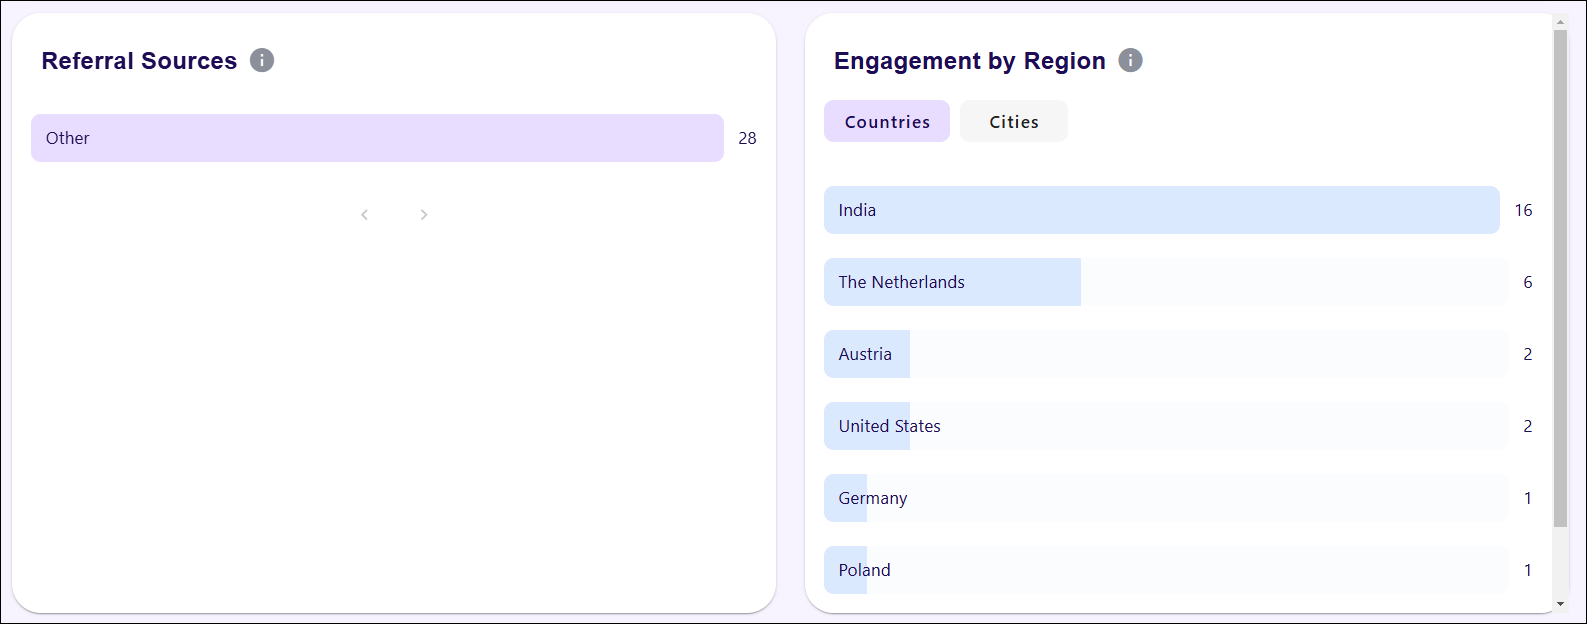
- Referral Sources: Displays the origin of clicks categorized by traffic sources, with a visual bar representing the volume of traffic from each source. The total number of clicks for each source is displayed on the right side, providing a quick overview of traffic distribution.
Engagement by Region: Shows user engagement data by location, with the option to toggle between the Country and City views. A horizontal bar chart visually represents the number of clicks from each location, while a ranked list displays the top-performing regions based on click volume. This provides insight into where the most engagement is coming from.
- Countries: Displays link engagement data segmented by country, offering a broad overview of where the most interactions occur globally. It helps users identify the top-performing countries in terms of link clicks, allowing for analysis of audience distribution across different regions.
- Cities: Narrows the engagement data to specific cities, providing a more granular view of where link interactions are concentrated within each country. By analysing city-level performance, you can target campaigns more precisely and tailor content to match the preferences and behaviours of audiences in high-performing urban areas.
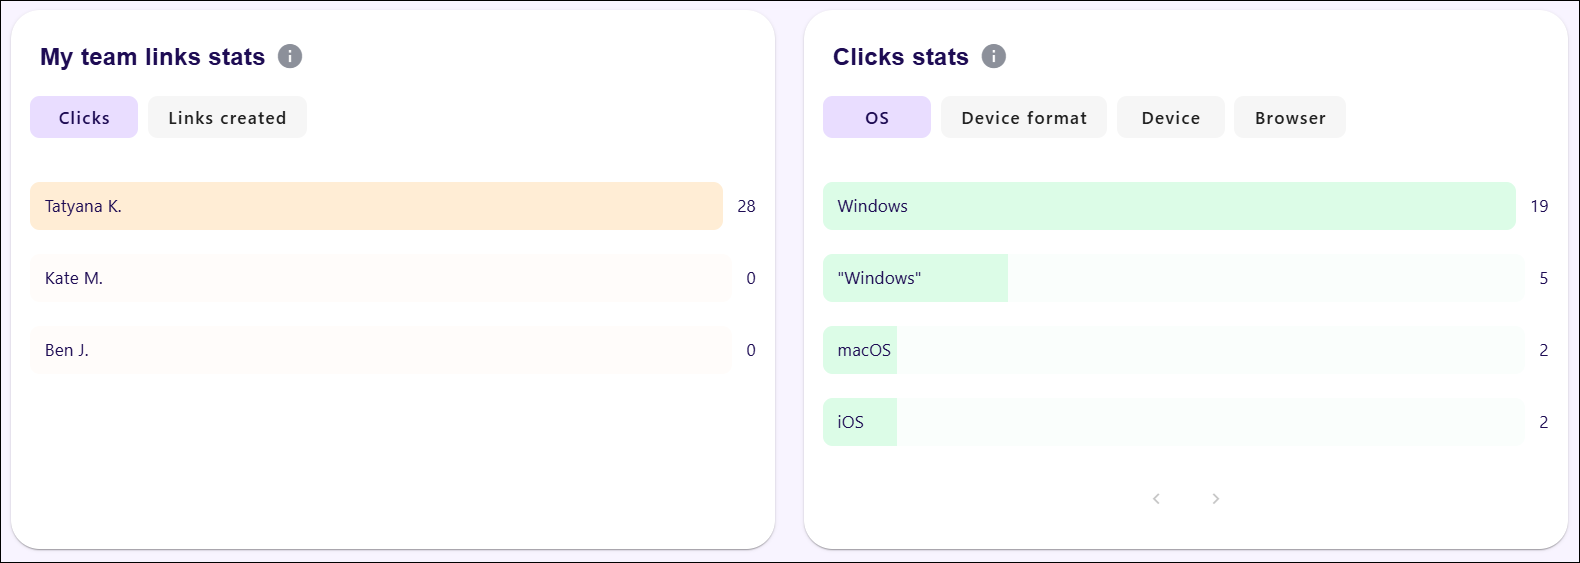
My team links stats: Highlights the activity of team members by displaying the number of clicks generated by each member’s links. A bar chart visually represents the performance of each team member, allowing quick comparison of contribution levels. There is an option to switch between views that show the number of clicks or the number of links created by each member.
- Clicks: Displays the number of times links have been clicked. This provides insight into the engagement and performance of shared links. The data can be used to identify which links are generating the most traffic and which team members are driving the highest engagement.
- Links created: Shows the total number of links generated by each team member. This metric helps track productivity and the contribution of each team member in creating new links for campaigns, promotions, or general usage.
Clicks stats: Breaks down click data by different categories such as operating system, device format, device type, and browser. The horizontal bar chart shows the distribution of clicks across these categories, with each bar representing the click volume for a specific platform or format. Tabs allow users to toggle between different breakdowns for more granular insights into how users are accessing the links.
- OS (Operating System): Represents the operating systems used by visitors when clicking on links. The breakdown includes platforms like Windows, macOS, iOS, and others. This data helps understand user preferences and optimize links for the most commonly used platforms.
- Device Format: Indicates the type of device format used by visitors, such as desktop, tablet, or mobile. This information is useful for tailoring campaigns and ensuring link performance across different device types.
- Device: Lists the specific devices visitors are using to interact with links. It may include details about brands or device models, providing further insights into user behavior.
- Browser: Tracks the web browsers used to access links, such as Chrome, Firefox, Safari, or Edge. This data can help ensure compatibility and optimize link performance based on the most frequently used browsers.
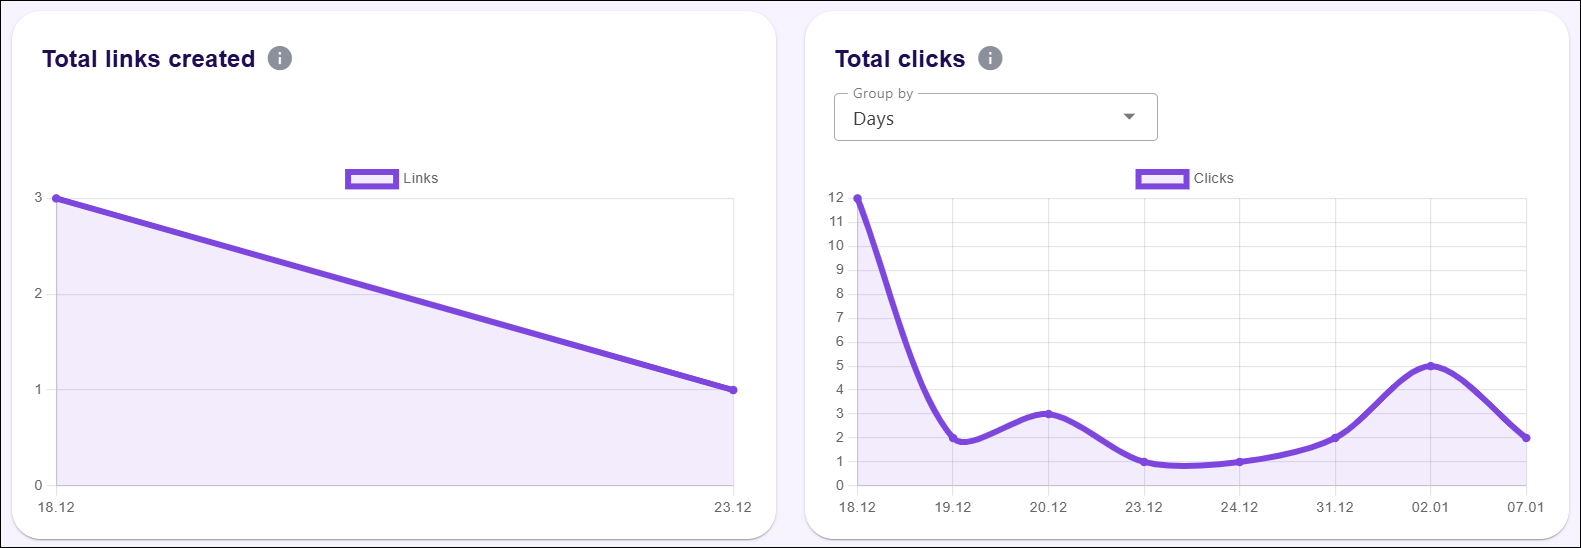
- Total links created: Visualizes the number of new links generated over a specific period. The graph displays the trend in link creation, allowing you to monitor their activity and assess how frequently new links are being added. It helps track productivity and campaign growth over time.
- Total clicks: Provides a graphical representation of the total number of clicks received by links within the selected date range. You can choose to group the data by days, or hours, enabling a detailed analysis of audience engagement patterns. The chart highlights fluctuations in clicks, offering insight into link performance and user interaction trends.
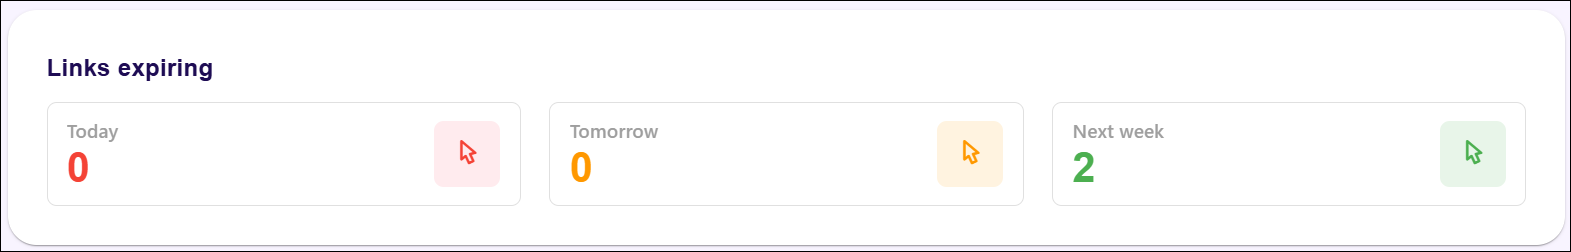
- Links expiring: Provides a summary of the links that are set to expire within specific timeframes. The panel is divided into three categories: links expiring today, links expiring tomorrow, and links expiring within the next week. Each section displays the count of expiring links, with visual indicators to draw attention to urgent expirations. This overview helps to manage active links and ensure timely renewals or extensions to avoid disruptions in accessibility.